
|
This week I was texted by a coach asking what impact the new three-point line will have on the game, and how it will affect the strategies behind shot selection. This is the exact type of question coaching staffs need to think about as they prepare and adjust for the upcoming season. The new three-point line was recently announced by the NCAA, moving the three-point line back to the international distance after experimenting with it in the 2018 and 2019 National Invitation Tournament. This approved rule change moves the line from 20’9” to 22’1 ¾”, which translates to a roughly 1’5” change in distance. The NCAA’s goal is clear – they would like to reduce the value of the three-point shot and, in turn, weaken the growth rate of three-point attempts. The chart below shows the rise of the three-point attempt rate in the college game. 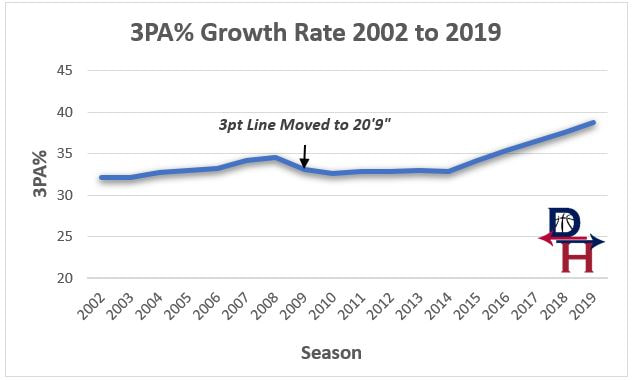 In the press release announcing these changes, the NCAA stated, “The 3-point shooting percentage of teams in the 2019 NIT was 33%, compared with their regular season average of 35.2%.” Their statement suggests that the D1 average should see about a 2.2 percentage point drop-off in 3P%. However, the NCAA’s attempt to interpret the impact of this change on shooting rate is poorly founded. Simply using the NIT tournaments data is not enough to understand the impact of a distance change over the course of a season. First, there is a sample size issue. There were only 31 games played in NIT in 2019, which doesn’t provide us with enough data to comfortably project next year’s three-point percentage. Second, the comparison made between regular season and tournament shooting percentages is misleading. Teams play easier competition throughout the year than they do in tournaments, which causes tournament shooting percentages to be lower than regular season percentages. Proof? Look no further than the NCAA tournament. The chart below compares the shooting percentages of NCAA tournament teams in the regular season versus NCAA tournament games. 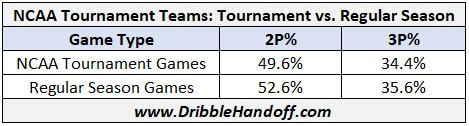 NCAA tournament teams shot 1.3 percentage points worse in NCAA tournament games than they did in the regular season. The distance wasn’t changed. The competition changed. The more logical and accurate way to measure this impact is to use shot distance data. Using shot distance data from last season, DribbleHandoff analyzed the projected drop-off from moving back about 1'5". This analysis showed that the D1 average decreased from 34.4% to 33.7%, a 0.7 percentage point change. Examining shots attempted between 21 to 26 feet (which accounts for over 90% of threes), the largest drop-off in any 1-foot increment is 1.2 percentage points. Therefore, even using the most extreme difference puts us below the NCAA’s suggested 2.2 percentage point drop. The question then becomes, how does this impact the value of a three-point shot in relation to the other shots? To compare shot locations, it is best to use expected point value, which is calculated by simply multiplying the shooting percentage of a given area by the points the shot is worth. For example, last season, threes were made at a 34.4% rate and are worth 3 points, so the expected point value is 1.03. The chart below uses data from the last five years to compare the expected point value for shots at the rim, midrange shots, and threes. 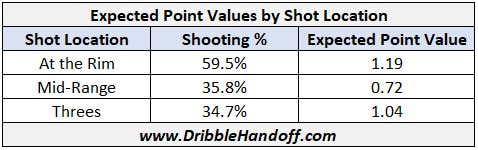 Over the last five years, shots at the rim are the most valuable shot. Threes were only .15 expected points behind these rim shots, while midrange shots were drastically less valuable. The estimated three-point shooting percentage given the new three-point line is roughly 33.7% based on last year’s data, which translates to an expected point value of 1.01. This is about a .03 expected point decrease versus the last five years. The difference between shots at the rim and threes is now more pronounced as the expected point margin will move from .15 to about .18. Threes are still a highly valuable shot at this percentage and therefore defenses will be forced to defend an even larger area, which will provide better spacing. This could lead to shots at the rim becoming even more efficient. In the same press release, the NCAA stated the following as one of their motivations for the distance change: “Slowing the trend of the 3-point shot becoming too prevalent in men’s college basketball by making the shot a bit more challenging, while at the same time keeping the shot an integral part of the game.” If a team reduces their three-point attempt rate and instead takes more shots at the rim, especially given good spacing, then that is a valuable trade-off. However, many analysts have suggested that players should now develop their mid-range game and should prepare to shot fake from the perimeter and take a few dribbles in for a mid-range jumper. This is the trap of the new rule change! Teams shouldn’t trade threes for mid-range shots because of this rule change. Even with the slightly lower shooting percentage from three, these shots from beyond the arc are still worth .29 expected points more than mid-range shots. Over the last five seasons, the college game has made great strides in reducing the percentage of shots that come from the mid-range area. 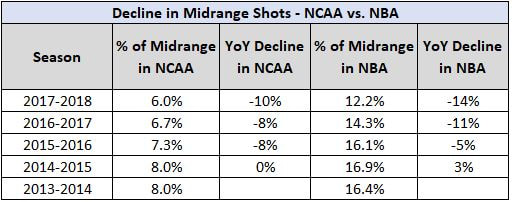 As I shared at the 2019 NABC Convention, I built a model which shows that a team wins one extra game, on average, for every five percentage points decreased in mid-range attempt rate. What should teams do with the 21-foot jump shots that they took last year when they were still worth three points? Reallocate them to either shots at the rim or a new three. Anything but using them to fund more mid-range shots. There will be teams that are influenced by the way the NCAA presented this rule change in their press release. Don’t be misled - increasing the mid-range attempt rate will only cause teams to be less efficient and win fewer games.
1 Comment
The Texas Tech run to the Final 4 is simply incredible. Despite their absence from the preseason AP poll, they are 2 wins away from being crowned NCAA Champions.
To understand Texas Tech’s dominance, DribbleHandoff analyzed Texas Tech’s on-court value using a method similar to the ones used in pieces on Duke and Villanova. This tactic offers tremendous value to coaches about their own team by providing data on the efficiency of their lineups, individual player’s strengths and weaknesses, and how each player impacts his teammates’ performance. First - the starting lineup. One of the most interesting insights in analyzing Texas Tech’s games is that their starting lineup has been ineffective with a -.01 net rating in conference play. However, the Red Raiders were remarkably more efficient when they swapped in Brandone Francis for one of the two bigs – Norense Odiase or Tariq Owens. The chart below shows this difference between the starting lineup and the lineups with Francis in for one of the bigs. 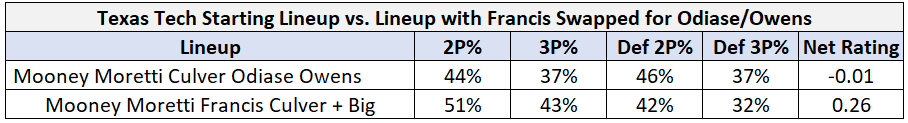
Swapping Francis in for one of the two bigs provides Texas Tech with more spacing and shooting offensively and a more versatile or switchable player on defense. Beyond his impact on the lineup, Francis’ value is clearly demonstrated by his individual on/off court data from Texas Tech’s conference season (excluding garbage time). With Francis on the court they had a +.18 net rating compared to a +.06 net rating with him off the court. 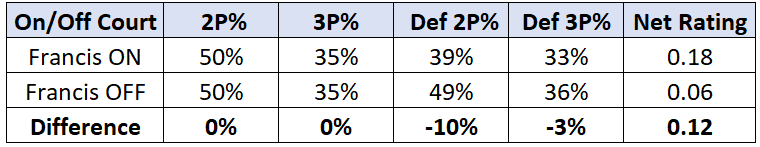
As noted in the chart above, he greatly impacts 2-point attempts on the defensive end. With Francis on the court, opponents shot 10% worse on 2’s than with him off the court. Texas Tech is better equipped to switch everything with Francis in for one of the two bigs. The 6’5” 215-pound Francis can defend a wider range of positions and skill sets than both the 6’8” 250-pound Odiase and 6’10” 205-pound Owens. The first possession of the game versus Iowa State is a great example. The Cyclones attacked the 2 bigs in the starting lineup by involving both bigs in a ball screen, which caused a miscommunication on the switch and resulted in an open 3 for Marial Shayok. Francis is key to Texas Tech’s success. He even has a positive impact on his teammates’ performance. The graphic below shows the net rating for each player when they are on the court with Francis versus without him. All of their rotation players have a higher net rating when playing with Francis compared to when they play without him. 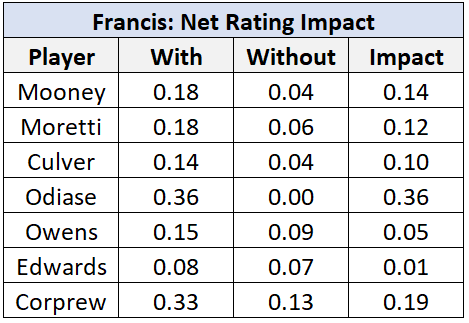
The Red Raiders will need Francis’ defense and ‘switchability’ to win a National Championship, especially against these remaining teams. Texas Tech’s tremendous season has the potential to end in an NCAA Championship – and it all starts with unsung hero, defensive stalwart, and sixth man Brandone Francis.
In the last article, I discussed that teams are running more of their offense with ball screens. Ball screen usage is up 24% in college basketball since 2013 and the trend is accelerating.
I argued that there are so many options available to an offense using a ball screen, that if you try to guard them all, you will not defend any option well. You will inevitably be forced to give up something. Using the data on all options involved in the ball screen, my suggestion was to force the midrange shot to the ball handler by going over with a soft hedge. However, defenses have another option to counter the value of the ball screen – switching. Switching ball screens is a viable and still underutilized strategy, and it has become more common in the NBA and NCAA as it neutralizes the immediate value of the ball screen and only involves the two players defending the screen. The downside of switching is that after the ball screen is switched, there is an opportunity for the offense to exploit positional/size mismatches. To facilitate and improve the effectiveness of the switch, teams are now rostering players that can cover multiple positions. Coaches want to switch everything, and having players who can guard a larger range of positions reduces the offense’s mismatch advantage. However, NBA offenses are now aggressively attacking the defense’s tendency to switch ball screens. Despite a coach’s desire to be able to switch everything, most teams do not have the defensive talent to truly switch 1 to 5. Offenses are now using the switch to force a mismatch that they can isolate. The table below shows the percentage of ball screen possessions that are isolations resulting from a ball screen switch for both the NBA and the NCAA. 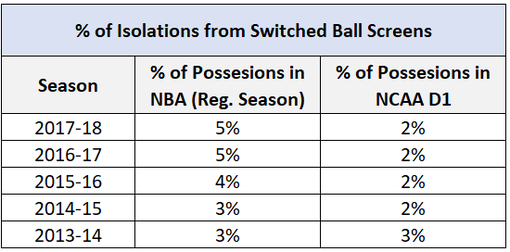
Over the last 5 seasons, these isolations continue to increase in the NBA while they have remained constant in college basketball. College coaches should study the NBA and find ways to incorporate this into their offense against switching defenses. This trend is rapidly accelerating in the NBA playoffs and really became noticeable last season. The table below shows the percentage for both the NBA regular season and playoffs. 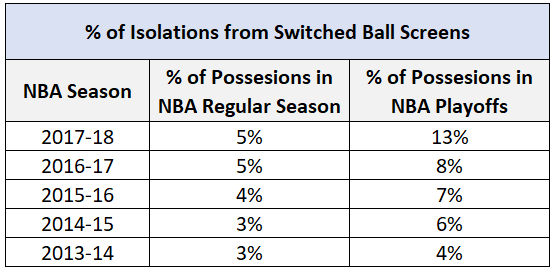
It’s one thing to acknowledge that this strategy is quickly trending upward, but is it providing an analytical advantage? To answer that, it’s best to compare apples to apples. Here, that means comparing the isolation possessions resulting from a switched ball screen versus the efficiency of the ball handler in the all other ball screen possessions. In the NBA regular season, the isolation possessions from a switch are roughly .05 to .10 points per possession (PPP) more valuable than the ball screen ball handler possessions. In last year’s playoffs, this number was .13 PPP and its value is accelerating. The table below shows the additional efficiency offered by the isolation in the playoffs over the last 3 years. 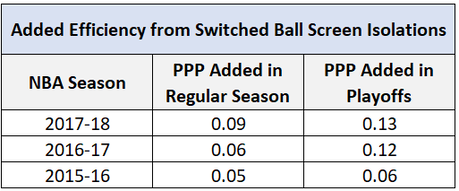
This is just the NBA average. If a team has an elite offensive player, the gains can be substantial. Look no farther than James Harden. In the 2018 playoffs, Harden averaged almost 6.5 possessions per game from an isolation after a ball screen switch. This was roughly 2 possessions more than the next closest player – LeBron James. It was also almost 2.5 possessions per game more than he averaged in the regular season. He wasn’t just a leader in the volume of these shots. He also had the highest efficiency among players with at least 1 possession per game in last year’s regular season. In the playoffs, the Rockets were even more committed to setting hard screens and forcing their man on to Harden. He then destroyed the mismatch at the rim and from 3: If you expected some sort of regression to the mean or fall off this season, think again. Harden has actually been more efficient than he was last year. 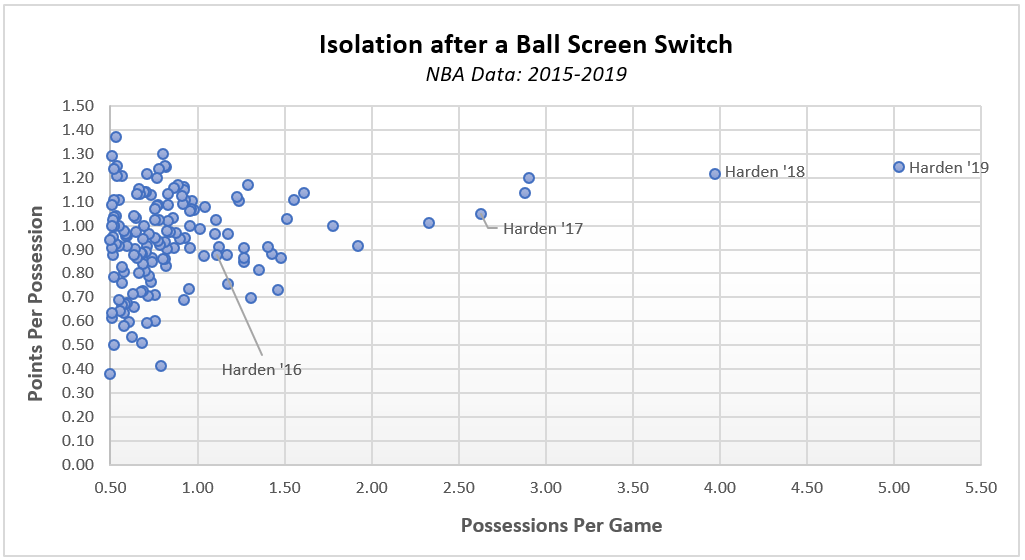
Players like Chris Paul, LeBron James, and Kevin Durant have also added this strategy to their repertoire. Which players could effectively add this at the college level? Many are capable, but two names stand out above the rest – Antoine Davis and Markus Howard. The players that have done it the best at the NBA level are both elite shooters and able to break their man down. These are players that can make shots off the dribble. The scatterplot below shows the usage and efficiency of players shooting off the dribble since 2013. 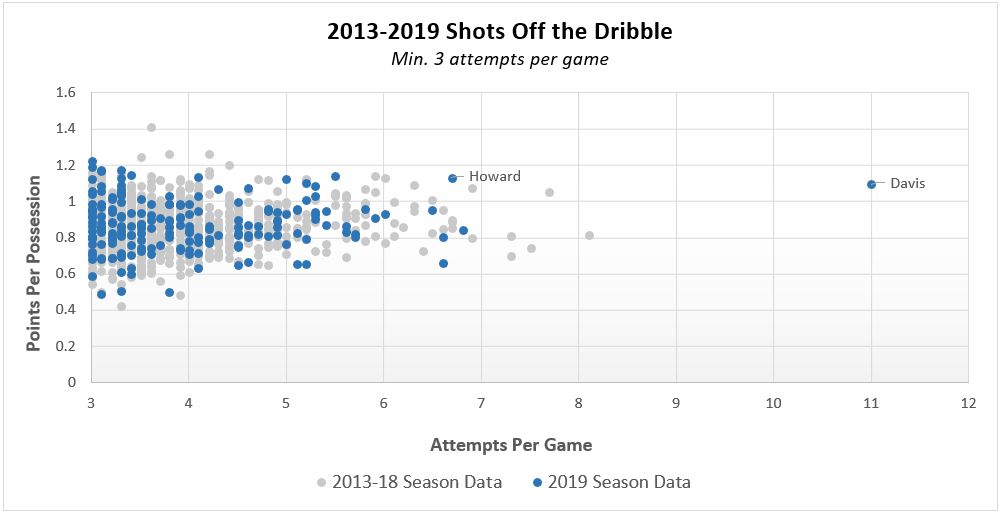
Davis’ attempts per game off the dribble are record-smashing: he’s averaging 3 more shots than the next closest player since 2013. Both players have already proven to be super- efficient when isolating after a switched ball screen, but the attempts should drastically increase. Howard is averaging 0.8 ball possessions per game with an incredible efficiency of 1.6 PPP. Davis isn’t far behind averaging 0.4 possessions and 1.13 PPP. The off the dribble shots below illustrates their potential dominance isolating against mismatches: Antoine Davis: Markus Howard: Finding elite players to attack the mismatch after the switch is only part of the equation; identifying the right players to target on defense will only make these possessions more efficient. Last year, NBA teams hunted for mismatches when they noticed that defenses were switching the screen, but it became even more prevalent in the playoffs. No one was targeted in the playoffs more than Steph Curry. He was isolated after the switch 3.5 possessions per game, despite only being targeted 0.35 possessions per game in the regular season. The table below shows the list of the 12 most targeted players in the playoffs ranked by their defensive efficiency. Despite only being targeted 1.7 possessions per game, Turner conceded the most points per possession. 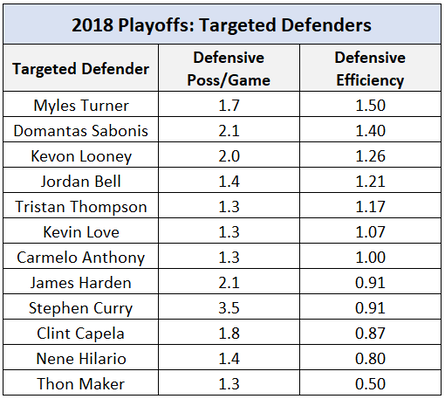
For coaches with one or more weak defenders that are likely to be targeted in switches, the best ball screen strategy remains over with a soft hedge to force the ball handler to take the midrange shot. And as with many of the strategies I have written about the returns will be greater for the coaches that are the first movers. The story was written a few years ago when shot data was examined in the basketball analytics movement – midrange shots are low efficiency shots. So why are some teams going against the trend and increasing their frequency of midrange shots? For this analysis, a midrange shot is everything in between the paint and 3-point line. Over the last 5 years, the FG% for midrange shots remained constant at roughly 35.5% to 36%. Therefore, this shot has an expected point value of 0.71 - 0.72 points per shot. How does this value compare to alternative shot locations? During this same period, shots within a few feet of the basket were worth between 1.16 and 1.21 points per shot. Farther paint shots exhibit an expected points per shot value that is closer to the midrange shots than shots within a few feet of the rim. Three-point shooting percentages over the last 5 years have been between 34% and 35%, but the extra point for a 3 makes these shots highly efficient at 1.04 points per shot. It’s also worth noting that corner threes provide additional value. Corner 3s are made at a 2.7% higher clip than above the break 3s, giving them a value of roughly 1.12 points per shot. Some have suggested that midrange volume helps a team open up the perimeter to get better looks from three. DribbleHandoff conducted a statistical analysis using the last few years of NBA and NCAA data to test this theory. The results do not support the notion that shooting more midrange shots will increase a team’s three-point percentage. Even if there was an increase, it would likely not be large enough to offset the value lost from shooting more shots from midrange instead of threes or shots at the rim. Coaches know the math. The midrange is dying. The table below illustrates the decline of the midrange for both the NBA and college basketball. 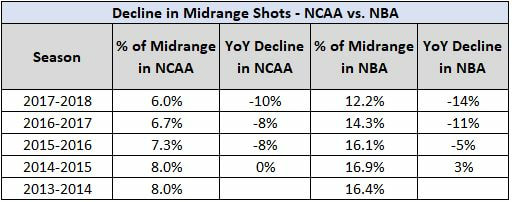 In fact, college basketball actually takes half of the amount of midrange shots as the NBA. As they should. The difference between a midrange shot and a three or shot at the rim is larger at the college basketball level than the NBA. Using data from the last 5 seasons, the midrange points per shot in the NBA is roughly .79 points per shot compared to college basketball’s .715 point per shot. Threes in the NBA are worth about 1.06 points per shot, while they are worth 1.04 in college basketball. Taking a midrange shot sacrifices at least .325 points per shot compared to alternative options, while it’s just .27 points per shot for the NBA. Context of specific possessions and team personnel can slightly dictate how a team will strategize their midrange shot selection, but, overall, coaches should study the team’s shooting the lowest percentage of midrange shots. The Houston Rockets, one of the NBA’s most analytically driven teams, have been shooting the lowest percentage of midrange shots for years. It’s helped propel them to the best offensive rating in the NBA over the last year and a half. Teams looking to completely transform their shot selection should study the changes made by Mike Budenholzer in his first season as the Bucks’ head coach. Last season, they were 3rd highest in percentage of shots from midrange. They are now 25th highest. Their offensive rating ranking jumped from 9th last year to 4th this season. College coaches remain at the forefront of the shot selection revolution. The table below shows the 5 teams with the lowest percentage of midrange shots this season. 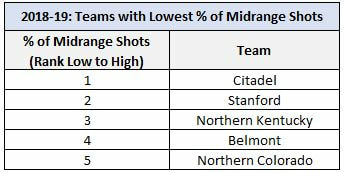 On the other end, Florida A&M and Kennesaw State are taking the highest percentage of shots from midrange by a large margin. What if Kennesaw State converted it’s 18% midrange shots to the D1 average of 6% and used the remaining 12% on 3s? Transforming their shot selection would result in more points per game even if they shot these 3s at the lowest 3P% of any team last season, 27.5%. If they shot them at the D1 average 3P% it would result in over a 2.3 point per game increase. An increase of 1-2 points per game is significant. Last season, 10% of games were decided by 2 points or less. This is also applicable at the player level. Charlie Brown are Markus Howard are two of the best shooters in college basketball. Brown is shooting a higher percentage from the field than Markus Howard. Yet, Howard has a higher effective field goal percentage (eFG%). The difference is in their shot selection. Brown shoots 14% of his shots from midrange compared to Howard’s 4%. There’s very little difference between these shooters, but Brown’s inefficient shot allocation will make it look like Howard is a better shooter. 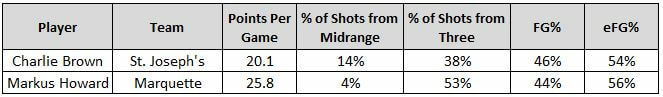 *Data through 1/13/18
The shot selection revolution is here, and the data suggests that the decline in midrange attempts will only continue.
The greatest upset in NCAA Tournament history hasn’t received enough attention. At least not how it happened.
The lazy conclusion is that De’Andre Hunter’s injury was too much for Virginia to overcome. Yes, Hunter would have made a big impact. But even accounting for his absence, UMBC was still a 20+ point underdog. They won the game with incredible strategic decisions. After the first half, the game was tied 21-21. Allowing only 53.4 points per game all season, this game was in Virginia’s wheelhouse. Knowing they would need more to win the game, UMBC Head Coach Ryan Odom and staff made a few key adjustments at halftime. From the start of the second half to the 8:30 mark, UMBC outscored Virginia 29-13 to take a 16-point lead. What changed? UMBC increased their pace offensively and pushed the ball in transition. After 0 transition possessions in the first half, they had 5 transition possessions during their 29-13 point run. They scored 9 points on these 5 possessions (1.8 PPP). Their average possession was 4.2 seconds faster during the run compared to the first half. According to Synergy, Virginia was the 2nd most efficient defense in the half court but 75th in transition defense efficiency. Opponents could push the ball in transition, attacking before Virginia’s pack line defense was set. Virginia’s transition defense gave up .2 more points per possession than their half-court defense – Odom took advantage of this edge. In the second half, UMBC also affected Virginia’s pace. They pressed. It wasn’t against their nature to press - they were 46th in press usage last year. After pressing on just 4 possessions in the first half, UMBC pressed on 10 of the 18 possessions during their run. They allowed only 5 points (.5 PPP) on those possessions. Pressing was key in stifling Virginia’s slow-paced offense. According to KenPom, Virginia had the slowest offensive pace in 2018. Their mover-blocker offense is efficient, but it takes time to get a good look. It's a role-based motion offense predicated on reading the defense. There are 3 “movers”, who are responsible for most of the scoring and ball handling. The 2 “blockers” set screens for the “movers” to get them free for open shots. The offense works so well because most college teams don’t have 3 players who can each make multiple correct reads each possession. UMBC reduced the number of correct reads they needed by forcing Virginia to burn more of the clock getting the ball up the floor against their press. Virginia’s efficiency against the press was .35 PPP worse than when UMBC didn’t press. Beyond changing the pace on both ends of the floor, Odom decided to attack Kyle Guy’s defense by incorporating him in ball screens, especially when he was guarding Jairus Lyles. According to Synergy, among power 6 players, Guy ranked as the 28th worst player at defending the ball handler on ball screens. The chart below shows percentage of the time that each defender guarded Lyles in the first half. 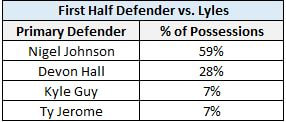
Most of the time he was guarded by Nigel Johnson or Devon Hall and they defended him well in ball screen situations. He didn’t score a point in the first half off of a ball screen. In above clip watch as Hall switches onto Lyles and then plays terrific on-ball defense. 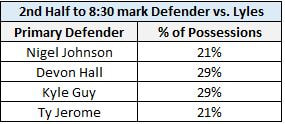
During their second half run, Lyles saw an even mix of all four defenders. Any time he was defended by Guy, UMBC set a ball screen for him. Two plays later, they used a double stack ball screen with Guy defending and again Lyles beat him to the rim. Even when Guy was not guarding Lyles, UMBC involved him in the ball screen. In the clip below, Guy switches onto him late and Lyles gets by him for a layup. With three strategic moves that changed the game, Odom and his team made NCAA tournament history. Come March, everyone will think a little harder before automatically advancing the #1 seeds to the next round in their bracket. Grad transfers are the new game-changers in college basketball. Why? Top teams lose talent to the NBA draft. Coaches can recruit months in advance to replace players they project to declare, but unanticipated draft entrants create a late demand to replenish this level of talent. Many of these teams are perennial powerhouses who need to replace their NBA draft losses with players who can make an immediate impact. The options are limited. At this point in the recruiting cycle, most of ESPN’s top 100 recruits have already committed to a program. Last season, just 10 of the top 100 players remained uncommitted on April 1st – 2 months before players have to decide if they will remain in the NBA draft or return to college. 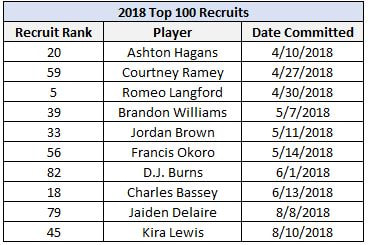 In most cases, adding an uncommitted recruit of this caliber is unlikely. Other teams have probably spent more time and energy recruiting this player. Therefore, the market has responded with players who qualify as grad transfers and are effective players in their league. Now, not only is the demand being met, but some advanced metrics suggest that the supply is improving. The value of the grad transfer market, with respect to the Power 6 conferences, has been relatively steady year after year. However, this year’s group of grad transfers is significantly better than any other group over the last 4 years. It might be one of the best in D1 history. On average, they scored more points per game and provided more of a winning impact. The chart below shows the points per game and win shares of the average Power 6 grad transfer over the last 4 seasons. 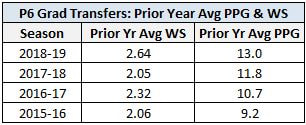 Even though this year’s group may be one of the best in NCAA history, the trend suggests that next year’s group may be even better, at least in terms of scoring. The average points per game for the grad transfer market has improved by 8-10% each year, adjusting for the D1 scoring increases year to year. 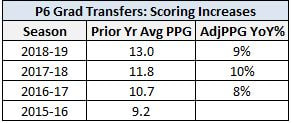 As both the value and demand continue to increase, how will players, coaches, and leagues respond? Will talented low and mid-major recruits try to red-shirt as a freshman for the ability to become a grad transfer in their final year? Will this affect how coaches recruit them? The trend in the grad transfer market is probably a sign of what’s to come for the low/mid major schools if the NCAA decides to allow all players to transfer without sitting one season. The NCAA could also go the other way and add more restrictions to the transfer rules, especially for grad transfers. One assistant coach commented, “I wouldn’t be surprised to see some changes to the 5th year transfer rules, which could be a game-changer for teams that are in that market.” When asked to give a suggestion he proposed, “If a 5th year transfer doesn’t complete his degree program, then that school gets dinged a scholarship for the next year. Something to increase accountability.” Whether the NCAA decides to loosen or tighten the transfer rules, there is one rule change effective this season that will impact the grad transfer market. The new rules allow for a player who goes undrafted to return to college basketball if they have remaining NCAA eligibility and accepted the NBA's combine invite. This change will cause more roster uncertainty, which will last longer than under the old rules. Last season, 11 players had remaining eligibility and accepted NBA combine invites but did not enter the draft. Under the new rules, these 11 players would be able to enter the NBA draft without any risk to their collegiate eligibility. The NBA draft is roughly 3 weeks after the deadline for players to decide to sign with an agent or return to school. More players with uncertain futures and longer deadlines will only increase the demand for grad transfers. Demand is certain to change, let’s see what next season’s supply brings…
As the adage goes, pressure creates diamonds. This is especially true when 19 to 20 year old players are forced to make the right decision under pressure again and again. Those who overlook pressing because it doesn’t fit within their style or system need to reconsider because it provides tremendous value.
Using Synergy data from the last 6 seasons, press possessions are about .04 PPP less than a non-press possession, excluding transition. The graphic below demonstrates the adjusted defensive PPP by group, according to their press usage. 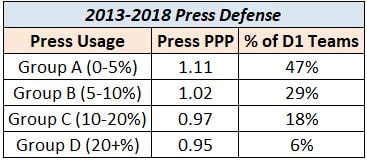
This analysis shows that teams that press more often have a more efficient press defense. Teams in group D are roughly .10 PPP better than the average non-press possession. This roughly translates to an extra 1.5 to 3 points saved per game for teams in Group D. The same information can also be seen in this scatter plot, which shows the PPP by press usage for every team from 2013 to 2018. 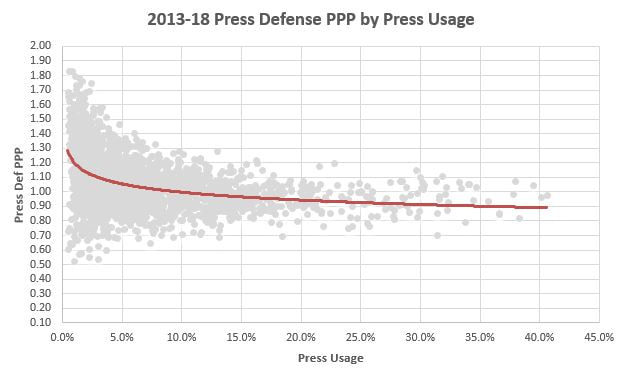
We can’t infer from this plot whether coaches with weaker press defenses choose to press less frequently, or whether defenses that press more become better through extra repetitions. But one thing is certain: pressing provides an analytical edge. The data suggests coaches are starting to realize the statistical gains of pressing. Last season, the percentage of press possessions in D1 hit its highest mark in the last 6 years. However, this percentage is still low. 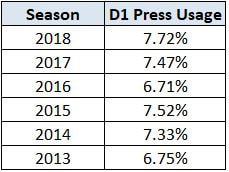
Press usage steadily rose from 2013 to 2015 but dipped in the 2016 season. The dip could be attributed to changes made to the rules entering the 2016 season, which emphasized increased freedom of movement for the offensive player and reduced physicality. Initially, this led coaches to shy away from pressing, anticipating how referees would then call the game. However, several less publicized changes made at the same time actually favored defenses that press, such as:
Removing a coach’s ability to call a live-ball timeout makes it much easier for pressing defenses to force a turnover. The most common turnovers caused by pressing are a result of a well-executed trap, a poor inbounds pass, or an offensive miscue such as a travel or a charge. Turnovers from well-executed traps: Turnovers from a poor inbounds decision: Turnovers from a travel or charge: The value of pressing goes beyond just forcing a turnover. It can also lead an offense into a rushed possession without running a set play and result in suboptimal shot selection. Moral of the story? Press. Press. Press. Not just in the final minutes when trying to get a steal, but on possessions throughout the game.
Stop. The post-up is not dead.
In fact, quite the opposite. A few years ago, the post-up entered a transformative process guided by analytics and new coaching strategies. The results? A revolutionary and efficient style for playing out of the post. Post-up shots are extremely inefficient shots. Defenses have long strategized how to defend the post: bringing double teams on the catch, on the bounce, from the baseline, etc. The additional defensive attention has made it difficult for bigs to score easily. However, the efficiency of the shot itself is only half the equation. What about the shot that comes from a post pass? It’s an incredibly efficient shot. Why? Again, defenses pay extra attention to post play. Double teams and collapsed defenses allow for high quality shots along the perimeter after a pass out of the post. Using raw data from Synergy, the chart below compares the efficiency of a post-up shot to a shot coming from a post pass. 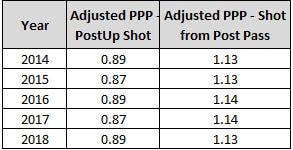
There is very little change in the efficiency from year to year, but the difference between the two plays is incredible. There is roughly a .25 PPP difference between the post-up shot and shot coming from a post pass. Not only are the shots coming from a post-up pass more efficient than a post-up shot, but they are even more efficient than shots coming off screens or spot-up attempts. 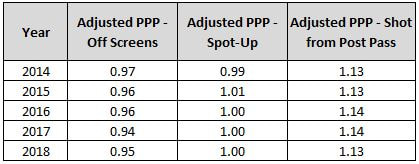
Teams need to take more of these shots and adjust their offense accordingly. There already is a shift in the percentages of shot vs. pass breakdown. The percentage of post-up possessions that result in pass out has risen from 23.4% of the time in 2014 to 28.4% in 2018. Recognizing the value of the post-up pass and increasing its usage is only the first stage of the post-up revolution. The second stage is actually devising strategies, creating sets, and finding players to exploit this advantage as much as possible. If teams want to post-up a player to generate these shots, why not post their best passer? For most teams, this is a guard. Guards are better at handling the pressure from double teams and are more accurate passers. Plus, now bigs can shoot better than ever and are capable of playing along the perimeter. This is known as an inverted offense. Several D1 programs have already started to invert their offense. The chart below shows the post-up efficiency of guards with a minimum of 10 post-up shots and 10 post pass possessions in 2017-2018. 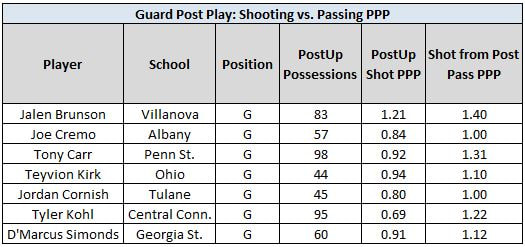
These early adopters have already seen great results as all of the guards had a pass out efficiency of 1.00 PPP or higher. Ohio Head Coach Saul Phillips, one of the 7 coaches to invert his offense last season, said, “It’s a great look – dump it down into the guard as another way of creating without having to work as hard.” The pass out of the post is more effective now than it was years ago, because bigs are becoming “stretchier” every year thanks to the 3-point revolution. Teams have realized the impact of the 3-point shot and are trying to put as many shooters on the floor as possible. Teams that invert their offense are able to exploit skill sets for both guards and bigs on defense. Running an offense with 4 players along the perimeter and a guard inside forces opposing bigs to switch, contain cutters, and stay with players through screens. Chances are there will be a defensive breakdown at some point during the possession. In the clip below, Villanova inverted their offense and Michigan blew a screen that allowed Jalen Brunson to find a cutting Donte DiVincenzo. In the next clip, all eyes are on Brunson in the post while Omari Spellman is wide open on the wing. Some teams may choose to go one-on-one in the post rather than bring help. That’s where teams need to recruit and develop the right player so that it creates a win-win situation for the offense. Phillips added, “Guards don’t practice post defense as much as forwards and centers. So those that develop post moves on offense are at an advantage.” Analyzing the guards who met the post possession threshold last year, one thing stands out and it’s no surprise: height. Reviewing the post possession chart with height as an added factor, every player on the list is 6’3 or taller. 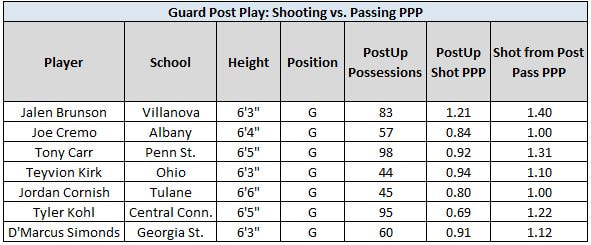
An added advantage for the posting guard is that, in some cases, they can target a weaker defender. If a defense is switching, the offense can target the weaker defender by incorporating him in a ball screen or dribble handoff. Texas Tech switched against Villanova in the Elite 8 and Jay Wright countered by targeting Keenan Evans in the post. Brunson ended the game 3/4 on post-ups with Evans guarding him. After losing Brunson to the NBA, Villanova snagged a proven post-up guard to run their inverted offense next season in Albany transfer Joe Cremo. Phillips weighed in, “In today’s game it’s easier to find bigs that want to shoot it from 3 and guards who will play out of the post. The key is getting the guard to embrace it and buy in.” This isn’t a fad – it’s the future of the post-up in basketball. Here are some of the best inverted offense plays from last season:
A few years ago, the NBA had an analytics movement. Similar to the one that occurred in baseball years prior, some of the long-held strategies were challenged. Teams began to prioritize efficiency over counting stats. This resulted in personnel changes; front offices began to favor stretch players and smaller lineups. Coaching staffs made strategic adjustments to improve ball movement, spacing, and pace at the expense of hero-ball.
Front offices tracked everything – shots, touches, lineups, player’s on/off court impact, expected shot value, etc. One of the earliest findings was that the corner 3 has the highest expected shot value. Data from the 2016-17 NBA season shows that corner 3s had a 3P% of 39.4%, while center and wing 3s were shot at 34.4% and 34.9% clips, respectively. Expected shot value is calculated using the location’s shooting % and point value. Therefore, the expected point value of a corner 3 in the NBA is 1.182 (.394 x 3). This marginal lift on corner 3s became a competitive advantage for the teams that studied the play types that generate these shots, why there was a lift, and how they could shoot more of them. So now everyone’s wondering: Does the lift on corner 3s exist in college basketball? Yes. An analysis of 2016-17 NCAA D1 data shows that there is a 2.5% increase in 3P% between corner 3s and non-corner 3s, or above the break 3s. 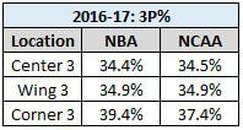
Some have argued that the corner 3’s value was due to the shorter distance to the rim as the NBA 3-point line is 22’ feet in the corner and extends up to 23’9”. However, the college 3-point line is equal at all spots along the line at 20’9” and there is still a substantial lift on corner 3s. Furthermore, using NBA data, a comparison can be made between corner 3s taken from 22’ and 2-point shots also taken from 22’. The 22’ corner 3s are made at a 39.4% clip compared to a 37.7% clip on 22’ shots from inside the arc. It’s not distance. So, then, what is the cause of the lift on corner 3s? An analysis of shot quality, using data from NBAsavant.com, provides the best explanation. The graphic below shows average dribbles, average touch time, and average defender distance for corner 3s and above the break 3s. 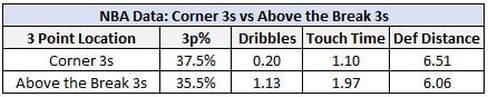
The corner 3 is less contested, on average, and a higher percentage of these shots are catch and shoot, which are made at higher rates than shots off the dribble. The database doesn’t provide true catch and shoot data, but 91% of the corner 3s were shot without a dribble compared to 72% for above the break 3s. This suggests it’s all about what happens before the shot – the corner 3 is the byproduct of the possession. The teams that take the most corner 3s get the defense to collapse and lose their assignments. The best ways to get a corner look is to penetrate the defense or getting a touch in the paint. Defenses that decide to double team players in the post risk getting beat on a pass to the corner. Is it possible to identify the teams with the highest lift on corner 3s through a specific stat? There isn’t a metric in college basketball that measures these types of possessions. However, the teams with the highest lifts on corner 3s had a player in common – a 6’8”+ big man who shot at least 60% on 2s, an assist rate above 8%, and a usage rate above 20%. These are taller big men who dominate in the paint and frequently draw double teams or extra attention. Once the double comes, they are adequate passers to find the open man in the corner. Teams with these players shot 5.1% better on corner 3s than above the break 3s - 2.6% better than the D1 average lift. Which teams had the highest lift last season? Creighton – 51% on Corner 3s (14.5% lift Corner 3 vs Above the Break) Middle Tennessee – 44.1% on Corner 3s (9.4% lift) Texas A&M – 40% on Corner 3s (9.1% lift) Shooting at a high percentage from the corner is only part of the equation. Teams need to try to create as many opportunities for corner 3s as possible. The NBA has used the data to their advantage – the NBA average for percentage of 3s that are corner 3s continues to increase. The chart below shows the percentage of 3s from the center, wing, and corner for the NBA and NCAA. 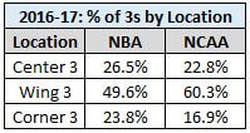
NBA teams take 7% more 3s from the corner than D1 teams – they studied this shot and know how to take more of them. Corner 3s remain an untapped goldmine in NCAA basketball right now. It’s time college coaches study and follow their NBA counterparts. Some have already caught on. In a press conference last year, Marshall Head Coach Dan D’Antoni, brother of 3-point revolutionist Mike D’Antoni, said, “The best shot in basketball is that corner three.” Who listened? “We don't measure our performance on if shots go in. We measure it on -- I don't mean to be too analytical -- expected shot value.” – Brad Stevens, Boston Celtics Head Coach |
Categories
All
Archives
January 2020
|
 RSS Feed
Site powered by Weebly. Managed by iPage