
|
The story was written a few years ago when shot data was examined in the basketball analytics movement – midrange shots are low efficiency shots. So why are some teams going against the trend and increasing their frequency of midrange shots? For this analysis, a midrange shot is everything in between the paint and 3-point line. Over the last 5 years, the FG% for midrange shots remained constant at roughly 35.5% to 36%. Therefore, this shot has an expected point value of 0.71 - 0.72 points per shot. How does this value compare to alternative shot locations? During this same period, shots within a few feet of the basket were worth between 1.16 and 1.21 points per shot. Farther paint shots exhibit an expected points per shot value that is closer to the midrange shots than shots within a few feet of the rim. Three-point shooting percentages over the last 5 years have been between 34% and 35%, but the extra point for a 3 makes these shots highly efficient at 1.04 points per shot. It’s also worth noting that corner threes provide additional value. Corner 3s are made at a 2.7% higher clip than above the break 3s, giving them a value of roughly 1.12 points per shot. Some have suggested that midrange volume helps a team open up the perimeter to get better looks from three. DribbleHandoff conducted a statistical analysis using the last few years of NBA and NCAA data to test this theory. The results do not support the notion that shooting more midrange shots will increase a team’s three-point percentage. Even if there was an increase, it would likely not be large enough to offset the value lost from shooting more shots from midrange instead of threes or shots at the rim. Coaches know the math. The midrange is dying. The table below illustrates the decline of the midrange for both the NBA and college basketball. 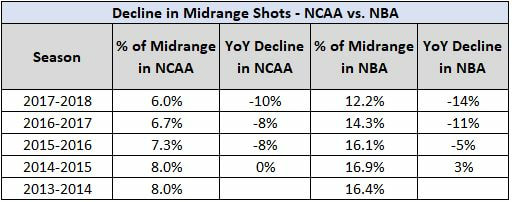 In fact, college basketball actually takes half of the amount of midrange shots as the NBA. As they should. The difference between a midrange shot and a three or shot at the rim is larger at the college basketball level than the NBA. Using data from the last 5 seasons, the midrange points per shot in the NBA is roughly .79 points per shot compared to college basketball’s .715 point per shot. Threes in the NBA are worth about 1.06 points per shot, while they are worth 1.04 in college basketball. Taking a midrange shot sacrifices at least .325 points per shot compared to alternative options, while it’s just .27 points per shot for the NBA. Context of specific possessions and team personnel can slightly dictate how a team will strategize their midrange shot selection, but, overall, coaches should study the team’s shooting the lowest percentage of midrange shots. The Houston Rockets, one of the NBA’s most analytically driven teams, have been shooting the lowest percentage of midrange shots for years. It’s helped propel them to the best offensive rating in the NBA over the last year and a half. Teams looking to completely transform their shot selection should study the changes made by Mike Budenholzer in his first season as the Bucks’ head coach. Last season, they were 3rd highest in percentage of shots from midrange. They are now 25th highest. Their offensive rating ranking jumped from 9th last year to 4th this season. College coaches remain at the forefront of the shot selection revolution. The table below shows the 5 teams with the lowest percentage of midrange shots this season. 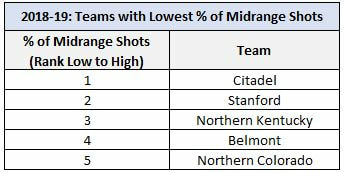 On the other end, Florida A&M and Kennesaw State are taking the highest percentage of shots from midrange by a large margin. What if Kennesaw State converted it’s 18% midrange shots to the D1 average of 6% and used the remaining 12% on 3s? Transforming their shot selection would result in more points per game even if they shot these 3s at the lowest 3P% of any team last season, 27.5%. If they shot them at the D1 average 3P% it would result in over a 2.3 point per game increase. An increase of 1-2 points per game is significant. Last season, 10% of games were decided by 2 points or less. This is also applicable at the player level. Charlie Brown are Markus Howard are two of the best shooters in college basketball. Brown is shooting a higher percentage from the field than Markus Howard. Yet, Howard has a higher effective field goal percentage (eFG%). The difference is in their shot selection. Brown shoots 14% of his shots from midrange compared to Howard’s 4%. There’s very little difference between these shooters, but Brown’s inefficient shot allocation will make it look like Howard is a better shooter. 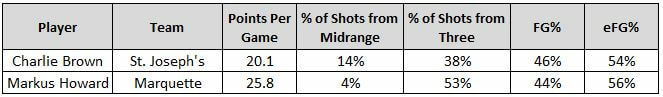 *Data through 1/13/18
The shot selection revolution is here, and the data suggests that the decline in midrange attempts will only continue.
4 Comments
Non-conference scheduling raises important questions for coaches. Is it better to build confidence and momentum with an easier non-conference slate or is there more value in creating a tough schedule that forces the team to meet the challenge? There’s been much debate over the best strategy, but there isn’t much, if any, analysis to show the impact of these games. So, DribbleHandoff sought to answer the question: what is the impact of the non-conference schedule on conference performance? In this effort we’ve analyzed the impact of the non-conference schedule on conference win percentage using data from 2012-2018. Instead of looking at non-conference strength of schedule, this analysis uses the percentage of non-conference games that are tier A or B games (NonConAB%). On his site, Ken Pomeroy provides a game tier (A, B, or none) based on game location and opponent rank. In an article introducing the game tiers he wrote, “A game in Tier A represents a top 50 opponent adjusting for the location of the game, and Tier B is the same concept for a top 100 opponent. Beating the 90th-ranked team on the road is about as difficult as beating the 50th-best team on a neutral floor, which is roughly as difficult as beating the 20th-best team on one’s home floor.” Two teams can have a similar ranking in non-conference strength of schedule but play very different types of opponents. For example, Kentucky and Florida had the 44th and 46th toughest non-conference strength of schedules in 2018, according to KenPom. Yet 62% of Florida’s non-conference games were tier A or B games, while they made up just 38% for Kentucky. The correlation between NonConAB% and conference win percentage is modest, but it’s statistically significant. To further understand the relationship, we built a model while controlling for a team’s preseason KenPom rank. The model suggests that an increase of 24% in NonConAB% (3 games on a 13 game non-conference schedule) translates to an increase of 6% in conference win % or an extra win on an 18-game conference slate. Scheduling tougher games can actually make your team better. The buckets below further demonstrate the impact on conference win % by increasing NonConAB% split out by KenPom’s preseason rank. 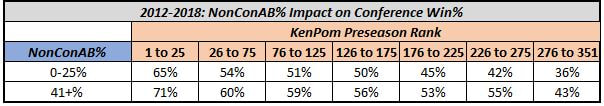 Many teams have the capacity to improve their NonConAB%, as the overall D1 rate of these games has remained constant at 30% over the last 7 years. Last season, 31 of KenPom’s top 100 preseason teams had a NonConAB% of 25% or less. Beyond the impact on conference performance, scheduling a higher percentage of A or B games has two additional benefits. Winning this type of game adds a high-quality win for an NCAA tournament resume. So far, the NCAA Tournament Committee hasn’t really punished teams for losing a game against a high-quality opponent. ESPN Bracketologist Joe Lunardi added, “The Committee has come to regard ‘good losses’ very highly. It’s almost impossible now to get an at-large bid with a weak non-conference schedule.” Additionally, top teams often pay lower ranked schools to play a home game for what they hope is an easy win. These ‘buy games’ offer an extra advantage for scheduling more A or B games. What’s better than winning a quadrant 1 or 2 game that improves the team’s performance in conference play, and being paid to do it? From a basketball strategy perspective there’s no reason not to play these games. Yes, coaches have voiced how difficult it is to schedule quality opponents, but it would be much easier if they were willing to go on the road. Look no further than a 2018 Final 4 team in Loyola Chicago. Referring to their buy game at Maryland this season, Head Coach Porter Moser said to Matt Norlander, "Here I am, a Final Four team, getting bought.” Moser may come around on this game by season’s end. He is getting paid to play a tier A game – it sounds perfect. Now just win the game to get the high quadrant win. Even if they don’t win their team may be better from playing it. There are other components to consider such as attendance related revenue and job security. Several head coaches mentioned that some coaches feel their job is safer with a higher win total regardless of their non-conference schedule difficulty. Multiple losses in non-conference play won't offset an extra win or two in conference play when a coach is on the hot seat. However, from a basketball strategy perspective, teams should be looking to increase their NonConAB%. Coaches should quickly lock in any tier A or B game, especially buy games. There is a true first mover advantage. Overall, this should improve the sport. While it’s a zero-sum game for this metric, the result of all teams taking advantage would lead to D1-wide improvement. Top teams looking to get A or B games will be forced to play more games against comparable competition or play more on the road. The improved competition is a win for fans, players, coaches, and the college game.
The greatest upset in NCAA Tournament history hasn’t received enough attention. At least not how it happened.
The lazy conclusion is that De’Andre Hunter’s injury was too much for Virginia to overcome. Yes, Hunter would have made a big impact. But even accounting for his absence, UMBC was still a 20+ point underdog. They won the game with incredible strategic decisions. After the first half, the game was tied 21-21. Allowing only 53.4 points per game all season, this game was in Virginia’s wheelhouse. Knowing they would need more to win the game, UMBC Head Coach Ryan Odom and staff made a few key adjustments at halftime. From the start of the second half to the 8:30 mark, UMBC outscored Virginia 29-13 to take a 16-point lead. What changed? UMBC increased their pace offensively and pushed the ball in transition. After 0 transition possessions in the first half, they had 5 transition possessions during their 29-13 point run. They scored 9 points on these 5 possessions (1.8 PPP). Their average possession was 4.2 seconds faster during the run compared to the first half. According to Synergy, Virginia was the 2nd most efficient defense in the half court but 75th in transition defense efficiency. Opponents could push the ball in transition, attacking before Virginia’s pack line defense was set. Virginia’s transition defense gave up .2 more points per possession than their half-court defense – Odom took advantage of this edge. In the second half, UMBC also affected Virginia’s pace. They pressed. It wasn’t against their nature to press - they were 46th in press usage last year. After pressing on just 4 possessions in the first half, UMBC pressed on 10 of the 18 possessions during their run. They allowed only 5 points (.5 PPP) on those possessions. Pressing was key in stifling Virginia’s slow-paced offense. According to KenPom, Virginia had the slowest offensive pace in 2018. Their mover-blocker offense is efficient, but it takes time to get a good look. It's a role-based motion offense predicated on reading the defense. There are 3 “movers”, who are responsible for most of the scoring and ball handling. The 2 “blockers” set screens for the “movers” to get them free for open shots. The offense works so well because most college teams don’t have 3 players who can each make multiple correct reads each possession. UMBC reduced the number of correct reads they needed by forcing Virginia to burn more of the clock getting the ball up the floor against their press. Virginia’s efficiency against the press was .35 PPP worse than when UMBC didn’t press. Beyond changing the pace on both ends of the floor, Odom decided to attack Kyle Guy’s defense by incorporating him in ball screens, especially when he was guarding Jairus Lyles. According to Synergy, among power 6 players, Guy ranked as the 28th worst player at defending the ball handler on ball screens. The chart below shows percentage of the time that each defender guarded Lyles in the first half. 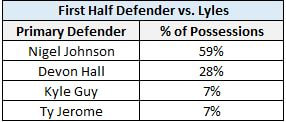
Most of the time he was guarded by Nigel Johnson or Devon Hall and they defended him well in ball screen situations. He didn’t score a point in the first half off of a ball screen. In above clip watch as Hall switches onto Lyles and then plays terrific on-ball defense. 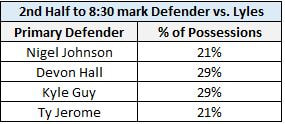
During their second half run, Lyles saw an even mix of all four defenders. Any time he was defended by Guy, UMBC set a ball screen for him. Two plays later, they used a double stack ball screen with Guy defending and again Lyles beat him to the rim. Even when Guy was not guarding Lyles, UMBC involved him in the ball screen. In the clip below, Guy switches onto him late and Lyles gets by him for a layup. With three strategic moves that changed the game, Odom and his team made NCAA tournament history. Come March, everyone will think a little harder before automatically advancing the #1 seeds to the next round in their bracket. Grad transfers are the new game-changers in college basketball. Why? Top teams lose talent to the NBA draft. Coaches can recruit months in advance to replace players they project to declare, but unanticipated draft entrants create a late demand to replenish this level of talent. Many of these teams are perennial powerhouses who need to replace their NBA draft losses with players who can make an immediate impact. The options are limited. At this point in the recruiting cycle, most of ESPN’s top 100 recruits have already committed to a program. Last season, just 10 of the top 100 players remained uncommitted on April 1st – 2 months before players have to decide if they will remain in the NBA draft or return to college. 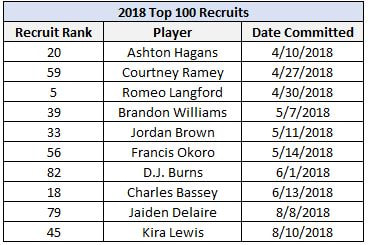 In most cases, adding an uncommitted recruit of this caliber is unlikely. Other teams have probably spent more time and energy recruiting this player. Therefore, the market has responded with players who qualify as grad transfers and are effective players in their league. Now, not only is the demand being met, but some advanced metrics suggest that the supply is improving. The value of the grad transfer market, with respect to the Power 6 conferences, has been relatively steady year after year. However, this year’s group of grad transfers is significantly better than any other group over the last 4 years. It might be one of the best in D1 history. On average, they scored more points per game and provided more of a winning impact. The chart below shows the points per game and win shares of the average Power 6 grad transfer over the last 4 seasons. 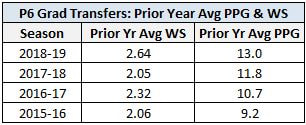 Even though this year’s group may be one of the best in NCAA history, the trend suggests that next year’s group may be even better, at least in terms of scoring. The average points per game for the grad transfer market has improved by 8-10% each year, adjusting for the D1 scoring increases year to year. 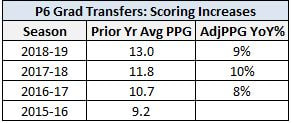 As both the value and demand continue to increase, how will players, coaches, and leagues respond? Will talented low and mid-major recruits try to red-shirt as a freshman for the ability to become a grad transfer in their final year? Will this affect how coaches recruit them? The trend in the grad transfer market is probably a sign of what’s to come for the low/mid major schools if the NCAA decides to allow all players to transfer without sitting one season. The NCAA could also go the other way and add more restrictions to the transfer rules, especially for grad transfers. One assistant coach commented, “I wouldn’t be surprised to see some changes to the 5th year transfer rules, which could be a game-changer for teams that are in that market.” When asked to give a suggestion he proposed, “If a 5th year transfer doesn’t complete his degree program, then that school gets dinged a scholarship for the next year. Something to increase accountability.” Whether the NCAA decides to loosen or tighten the transfer rules, there is one rule change effective this season that will impact the grad transfer market. The new rules allow for a player who goes undrafted to return to college basketball if they have remaining NCAA eligibility and accepted the NBA's combine invite. This change will cause more roster uncertainty, which will last longer than under the old rules. Last season, 11 players had remaining eligibility and accepted NBA combine invites but did not enter the draft. Under the new rules, these 11 players would be able to enter the NBA draft without any risk to their collegiate eligibility. The NBA draft is roughly 3 weeks after the deadline for players to decide to sign with an agent or return to school. More players with uncertain futures and longer deadlines will only increase the demand for grad transfers. Demand is certain to change, let’s see what next season’s supply brings…
As the adage goes, pressure creates diamonds. This is especially true when 19 to 20 year old players are forced to make the right decision under pressure again and again. Those who overlook pressing because it doesn’t fit within their style or system need to reconsider because it provides tremendous value.
Using Synergy data from the last 6 seasons, press possessions are about .04 PPP less than a non-press possession, excluding transition. The graphic below demonstrates the adjusted defensive PPP by group, according to their press usage. 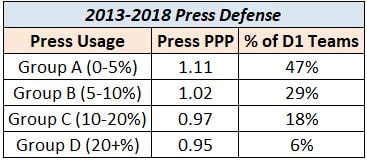
This analysis shows that teams that press more often have a more efficient press defense. Teams in group D are roughly .10 PPP better than the average non-press possession. This roughly translates to an extra 1.5 to 3 points saved per game for teams in Group D. The same information can also be seen in this scatter plot, which shows the PPP by press usage for every team from 2013 to 2018. 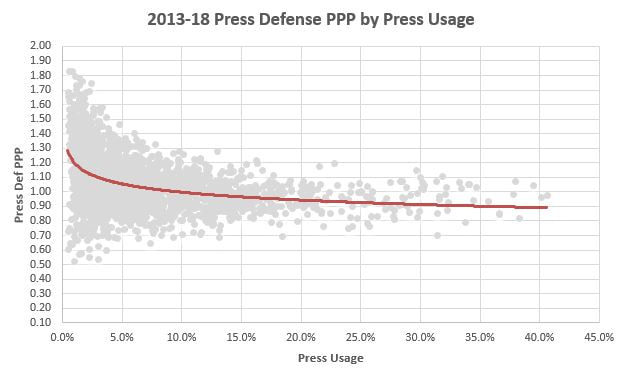
We can’t infer from this plot whether coaches with weaker press defenses choose to press less frequently, or whether defenses that press more become better through extra repetitions. But one thing is certain: pressing provides an analytical edge. The data suggests coaches are starting to realize the statistical gains of pressing. Last season, the percentage of press possessions in D1 hit its highest mark in the last 6 years. However, this percentage is still low. 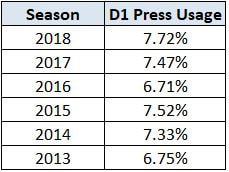
Press usage steadily rose from 2013 to 2015 but dipped in the 2016 season. The dip could be attributed to changes made to the rules entering the 2016 season, which emphasized increased freedom of movement for the offensive player and reduced physicality. Initially, this led coaches to shy away from pressing, anticipating how referees would then call the game. However, several less publicized changes made at the same time actually favored defenses that press, such as:
Removing a coach’s ability to call a live-ball timeout makes it much easier for pressing defenses to force a turnover. The most common turnovers caused by pressing are a result of a well-executed trap, a poor inbounds pass, or an offensive miscue such as a travel or a charge. Turnovers from well-executed traps: Turnovers from a poor inbounds decision: Turnovers from a travel or charge: The value of pressing goes beyond just forcing a turnover. It can also lead an offense into a rushed possession without running a set play and result in suboptimal shot selection. Moral of the story? Press. Press. Press. Not just in the final minutes when trying to get a steal, but on possessions throughout the game.
The model for projecting the standings and players uses on-court metrics like BPM, ORTG, DRTG, and more to create a value-added metric for all returning players.
Projected 2018-19 Big 12 Standings 1. Kansas 2. Texas 3. Texas Tech 4. West Virginia 5. Baylor 6. Iowa State 7. Kansas State 8. TCU 9. Oklahoma 10. Oklahoma State Best 5 Players: Udoka Azubuike - The highest 2P% in D1 last season. He will be even better this year with Dedric Lawson feeding him the ball in a high-low. Highest returning value-added player in Big 12. Dedric Lawson - He could be the first player in 25+ years to average 10+ PPG, 10+ RPG, and 5+ APG. His sophomore year at Memphis he posted 19.2, 9.9, and 3.3. Dean Wade - Shot over 50% from 2, 40% from 3, and 75% from the line… at 6'10”! Kansas State’s offense was +.128 PPP better with him in the game. Jarrett Culver – Best 3&D player in the conference. The 6'5" guard blocks shots, gets steals, and hit 38% from 3 last year. Sagaba Konate - Had 6 games with 6+ blocks - tied for 2nd most in D1. He’s one of the better defenders in the conference. He will be a force at the rim more consistently this season. Best Freshman: Quentin Grimes 5 Breakout Returning Players: Mark Vital Lindell Wigginton Brady Manek Matt Coleman Brandone Francis 5 Impact Transfers: Marial Shayok Dedric Lawson Keelon Lawson Matt Mooney Mario Kegler Best Offensive Player Dean Wade - Not only a knockdown shooter, but he’s also an incredibly gifted passer for his size - highest AST:TO ratio in D1 for player 6'10" or taller last season. Best Defensive Player Jarrett Culver - Highest returning player in defensive value-added. Excellent ball screen defense. Arguably the best 3&D player in the country. Big East POY: Udoka Azubuike – Last season, Azubuike had the highest impact on teammate NetRtg among the Jayhawks’ rotation players. He’s a force at both ends and is virtually unguardable now in the post 1 on 1. Bill Self and the coaching staff have done an excellent job finding ways to get him the ball in the post. There are two plays they typically run to set up an Azubuike post pin. Azubuike Post-Pin #1 Azubuike Post-Pin #2 What to Watch: The Jayhawks’ Spacing & High-Low Action Kansas will incorporate more of the high-low action that Bill Self loves to run with the addition of Dedric Lawson. It’s more than just the high-low. Self thrives with a playmaking and skilled forward, like Perry Ellis, paired with a rim ruining bruiser. That’s exactly what he’ll have this year with Lawson and Azubuike. Early in the season, watch the Jayhawks’ spacing and how defenses choose to defend their bigs. In 2014-15, their high-low was incredibly difficult to defend because Perry Ellis shot 53% on non-paint 2s. Defenses were forced to cover Ellis’ mid-range jumper, which allowed their 5-man to work 1 on 1 in the paint. As a sophomore at Memphis, Dedric Lawson only made 31% of his non-paint 2s. If Lawson isn’t efficient in the mid-range game this season, then defenses will elect to give him that shot and will bring help in the post against Azubuike.
Projected 2018-19 Big East Standings
1. Villanova 2. Butler 3. Marquette 4. Providence 5. Creighton 6. Seton Hall 7. Xavier 8. St. John's 9. DePaul 10. Georgetown *Standings assume Mustapha Heron is ineligible for St. John's. Update will be released if eligible. Best 5 Players: Shamorie Ponds - One of 17 players with at least 6 30+ point games. St. John's was 2-4 in those games. They relied on him too heavily. Increased usage rate came with a big dip in efficiency. Eric Paschall - He shot 1/25 (4%) from 3 in his first 13 games last year. He then went on to shoot 46% from 3 for the rest of the season. Most well rounded game in the Big East. Sam Hauser - In the last 25 years, only 3 players have posted two seasons of 5+ RPG while shooting over 50% from 2, 40% from 3, and 80% from the line. Doug McDermott, Alec Peters, & Hauser. Sean McDermott - Super efficient shooter who will get more looks with Kelan Martin (16 shots per game) graduating. Martin Krampelj – He could be the most underrated player in the Big East. Elite team defender. Leading scorer and rebounder returning for Creighton. Ranked 15th in PPP according to Synergy. Best Freshman Jahvon Quinerly – Skilled player with good vision. He will be incredibly tough to defend in ball screen situations and will create open looks for Villanova’s knockdown shooters. 5 Breakout Returning Players: Naji Marshall – Great freshman season. Minutes will sky rocket. Future All-Big East 1st teamer. Jermaine Samuels – Could be the next in the line of Hart/Bridges. Has the body and talent. Justin Simon – One of the better 2-way players in the conference. All-Big East level defender. Ty-Shon Alexander - Long guard who made 34% from 3 as a freshman and 79% at the rim. Tyrique Jones – Gifted big who looks to be in the best shape of his college career. 5 Impact Transfers: Jordan Tucker – Could end up being one of the best scorers in the Big East once he's eligible. Joseph Chartouny – Will help give Marquette a defensive identity. Nice fit with Howard. Joe Cremo – Dynamic guard. Jay Wright may use him in the post in his inverted offense. Jalen Coleman-Lands - A career 40% shooter from 3 and a former top 40 recruit. Taurean Thompson - Talented big with room to grow. Will get plenty of minutes at Seton Hall. Best Offensive Player: Markus Howard – Pure scorer who will facilitate more than last year with Andrew Rowsey gone. One of the nation’s best shooters over the last few seasons. Best Defensive Player: Martin Krampelj - Doesn't show up in the traditional box score stats, but he’s an excellent team defender. Led the conference in DRTG. Big East POY: Eric Paschall – On the best team in the Big East, Paschall will be a leader and stat sheet stuffer. What to Watch: Villanova's Inverted Offense Last year, Jay Wright often posted Jalen Brunson in an inverted offense. They used it to force opposing bigs to switch along the perimeter, target defenders, and let the bigger/stronger Brunson work 1 on 1 in the post. After losing Brunson to the NBA, Villanova snagged a proven post-up guard to run their inverted offense next season in Albany transfer Joe Cremo. 
Cremo was one of 7 guards with at least 10 shots and 10 passes out of the post last year. The 6'4" guard has great footwork, size, and can see the floor well. Expect Wright to post Cremo with the likes of Quinerly, Booth, Swider, and Paschall along the perimeter. Here is a look at Cremo in an inverted set at Albany last season:
Stop. The post-up is not dead.
In fact, quite the opposite. A few years ago, the post-up entered a transformative process guided by analytics and new coaching strategies. The results? A revolutionary and efficient style for playing out of the post. Post-up shots are extremely inefficient shots. Defenses have long strategized how to defend the post: bringing double teams on the catch, on the bounce, from the baseline, etc. The additional defensive attention has made it difficult for bigs to score easily. However, the efficiency of the shot itself is only half the equation. What about the shot that comes from a post pass? It’s an incredibly efficient shot. Why? Again, defenses pay extra attention to post play. Double teams and collapsed defenses allow for high quality shots along the perimeter after a pass out of the post. Using raw data from Synergy, the chart below compares the efficiency of a post-up shot to a shot coming from a post pass. 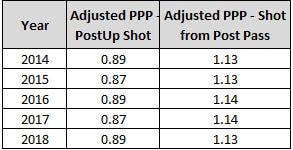
There is very little change in the efficiency from year to year, but the difference between the two plays is incredible. There is roughly a .25 PPP difference between the post-up shot and shot coming from a post pass. Not only are the shots coming from a post-up pass more efficient than a post-up shot, but they are even more efficient than shots coming off screens or spot-up attempts. 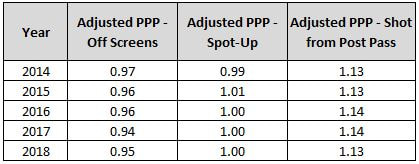
Teams need to take more of these shots and adjust their offense accordingly. There already is a shift in the percentages of shot vs. pass breakdown. The percentage of post-up possessions that result in pass out has risen from 23.4% of the time in 2014 to 28.4% in 2018. Recognizing the value of the post-up pass and increasing its usage is only the first stage of the post-up revolution. The second stage is actually devising strategies, creating sets, and finding players to exploit this advantage as much as possible. If teams want to post-up a player to generate these shots, why not post their best passer? For most teams, this is a guard. Guards are better at handling the pressure from double teams and are more accurate passers. Plus, now bigs can shoot better than ever and are capable of playing along the perimeter. This is known as an inverted offense. Several D1 programs have already started to invert their offense. The chart below shows the post-up efficiency of guards with a minimum of 10 post-up shots and 10 post pass possessions in 2017-2018. 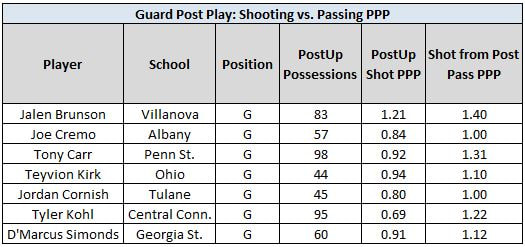
These early adopters have already seen great results as all of the guards had a pass out efficiency of 1.00 PPP or higher. Ohio Head Coach Saul Phillips, one of the 7 coaches to invert his offense last season, said, “It’s a great look – dump it down into the guard as another way of creating without having to work as hard.” The pass out of the post is more effective now than it was years ago, because bigs are becoming “stretchier” every year thanks to the 3-point revolution. Teams have realized the impact of the 3-point shot and are trying to put as many shooters on the floor as possible. Teams that invert their offense are able to exploit skill sets for both guards and bigs on defense. Running an offense with 4 players along the perimeter and a guard inside forces opposing bigs to switch, contain cutters, and stay with players through screens. Chances are there will be a defensive breakdown at some point during the possession. In the clip below, Villanova inverted their offense and Michigan blew a screen that allowed Jalen Brunson to find a cutting Donte DiVincenzo. In the next clip, all eyes are on Brunson in the post while Omari Spellman is wide open on the wing. Some teams may choose to go one-on-one in the post rather than bring help. That’s where teams need to recruit and develop the right player so that it creates a win-win situation for the offense. Phillips added, “Guards don’t practice post defense as much as forwards and centers. So those that develop post moves on offense are at an advantage.” Analyzing the guards who met the post possession threshold last year, one thing stands out and it’s no surprise: height. Reviewing the post possession chart with height as an added factor, every player on the list is 6’3 or taller. 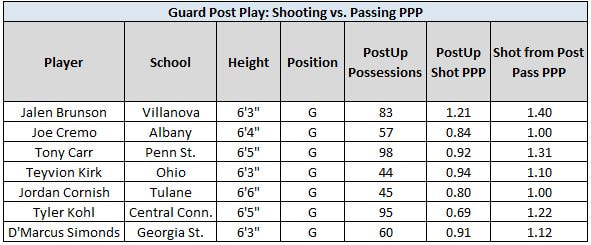
An added advantage for the posting guard is that, in some cases, they can target a weaker defender. If a defense is switching, the offense can target the weaker defender by incorporating him in a ball screen or dribble handoff. Texas Tech switched against Villanova in the Elite 8 and Jay Wright countered by targeting Keenan Evans in the post. Brunson ended the game 3/4 on post-ups with Evans guarding him. After losing Brunson to the NBA, Villanova snagged a proven post-up guard to run their inverted offense next season in Albany transfer Joe Cremo. Phillips weighed in, “In today’s game it’s easier to find bigs that want to shoot it from 3 and guards who will play out of the post. The key is getting the guard to embrace it and buy in.” This isn’t a fad – it’s the future of the post-up in basketball. Here are some of the best inverted offense plays from last season: In the last 5 years, Villanova has won 2 National Championships, 4 Big East regular season titles, and 89% of their games – the highest winning percentage in D1. Also, during this period, they’ve landed a total of zero top 10 recruits. Zero. Top 10 recruits are highly coveted by college programs and are likely to become one-and-done players. One-and-dones have long dominated recruiting conversations, preseason rankings, and media attention. Teams with multiple top recruits are often predicted to win the championship while those teams lacking this talent are overlooked and undervalued. They won’t be overlooked any longer. Jay Wright changed the game. Villanova won their 2 Championships with a rotation of upperclassman who were ranked outside of the top 10 as freshman. The numbers back Wright’s personnel strategy. Using advanced metrics from the last 5 years we can estimate the impact of these recruits on the power 6 conferences (adding in the Big East). BPM, sports-reference’s estimated box plus-minus, and NetRtg are the metrics used in this analysis to estimate on/off court impact. 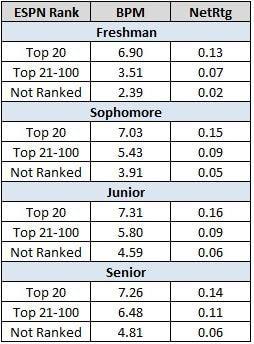 As expected, top 20 freshmen are the most valuable players in college basketball. However, players ranked in the top 100 as freshman are just as valuable by their junior or season year. Despite only a slight drop-off in impact and delayed returns, teams still overwhelmingly prefer the top ranked recruits. Imagine the impact of these upperclassmen if they were in a program that specialized in player development. The additional lift from development could make these players substantially more valuable than the top 20 freshman. You don’t have to imagine – this is Villanova’s blueprint. After years of early tournament losses with players that didn’t develop to Wright’s expectations, player development became his top priority. One key decision was the hiring of assistant coach Ashley Howard, now the head coach of La Salle University. Howard is known as a visionary in player development. He helped Mikal Bridges grow from a raw talented redshirt freshman into a 2018 lottery pick. Creating a culture for player development is only half of the equation. They needed to find players who desired to be coached and developed, even if that meant taking a player ranked 97th over a player ranked 33rd. The actual rank within the top 100 rankings doesn’t matter too much anyway – the graphic below shows they’re a fairly inaccurate measure. Recruiting analysts are successful at identifying the top 20 players amongst the group, but struggle to differentiate the rest. 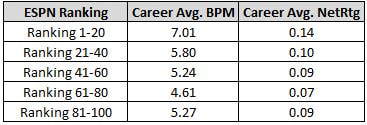 Players ranked in the top 20 definitely provide the highest average impact per season over the course of their career. Even the next group, 21-40, can be considered a distinct tier. However, there is no difference in average career value for players ranked 41-100. The Wildcats’ staff thoroughly searches for players in this range, who they believe are equally as talented as their top 100 counterparts, but are hungrier and more coachable. Over the last 5 years, players ranked in this range remained at Villanova an average of 1 year longer than rest of the top 41-100 recruits stayed at their school. This is the highest among teams with at least 4 of these recruits. The answer seems simple, right? Villanova recruits players they are looking to develop; therefore, they require more time in college to reach the same level of performance. Wrong. Actually, not only are they as good as their fellow 41-100 recruits, they are significantly better when comparing their underclassmen years.  Does Villanova find the undervalued talents, or does the development process impact these players as early as their freshman and sophomore years? It’s most likely both. By their junior and senior years there’s no competition.  So, why do Villanova players stay a year longer than their top 41-100 counterparts? That’s the result of recruiting hungrier players. They stay to continue improving their game. They stay to win. Bad news for the Big East and the rest of the power conferences… it’s only going to continue. Joining the 2018-19 Wildcat’s team are two prospects ranked in the 21-40 range, Jahvon Quinerly and Cole Swider, as well as 41-100 prospect in Brandon Slater. Expect more championships. So while Jay Wright and staff change the game, is anyone else paying attention? Most aren’t, but give Tony Bennett and Virginia credit. They’re close. Virginia has also had 8 recruits in the 41-100 range over the last 5 years, including Malcolm Brogdon, Justin Anderson, and London Perrantes. Similar to Villanova, they have found highly talented recruits who have dominated even in their first two seasons. 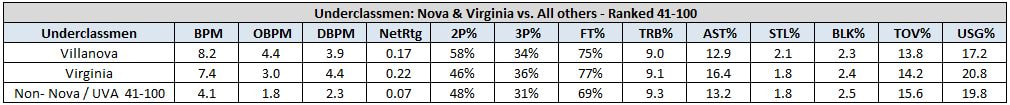 The Cavaliers have also done an incredible job in developing these recruits throughout their careers. Analytically, their developmental lift is almost identical to Villanova. 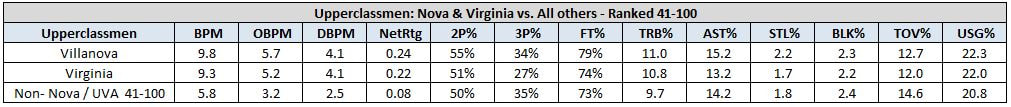 Bennett and staff are reaping the benefits of recruiting De’Andre Hunter (#74) in this 41-100 range. Hunter is heading into his sophomore season after redshirting as a freshman and will be an All-American in 2018-19. He’s arguably the best two-way player returning next season. Villanova will continue, but expect Virginia to win a title in the next few years. The strategy is there. The regular season wins are there. The titles will come. The chart below shows the teams with the highest winning percentage from 2013-2018 among the power conferences. Kansas, Duke, Arizona, and Kentucky are one-and-done factories and the results have been great. Yet, by recruiting and developing the right players, Virginia is in the top 3 and Villanova is in its own tier. 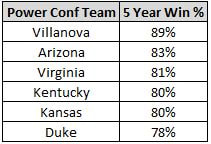 On Thursday, 16 seed Penn will face 1 seed Kansas and attempt to become the first 16 seed to ever beat a 1 seed. If it were ever going to happen – today is the day – this is the matchup. First, it’s worth noting that these teams are both slightly mis-seeded. Analytically, Kansas resembles more of a 2-3 seeded team, while Penn that of a 14/15 seed. We’ve seen 15s beat 2s and 14 beat 3s. If this game was a 14 vs. 3, would people be more likely to pick Penn? It shouldn’t change your mind. The matchup is still the same - the teams are still the same. Kansas plays 4 guards with 7-footer, Udoka Azubuike, manning the inside. They’ve been very successful so far this season, especially from beyond the arc - 10th in the nation in 3P%. It’s not surprising as playing 4 guards and a dominant post player often leads to an elite 3P%. However, Penn is the 2nd best team in the nation at defending the 3. This is primarily driven by their ability to force and contest tough shots. According to a ShotQ, they have the best shot quality defense on jump shots. Using season long statistics and trends, Penn could not have asked for a better 1 seed matchup. Two questions still remain. 1. “Can Penn defend 7’0” center Azubuike?” 2. “Penn could stifle Kansas defensively, but can they score on Kansas?” Azubuike hurt his leg and missed the entire Big 12 Conference Tournament. He’s a game time decision for their matchup and it doesn’t seem promising. If he can’t go, both of these questions are answered. Kansas doesn’t really use their bench. Of 351 D1 teams, their starting lineup plays the 6th highest percentage of available minutes in non-garbage time situations. That starting lineup consists of Devonte’ Graham, Malik Newman, Legearld Vick, Svi Mykhailiuk, and, usually, Azubuike. With the 7-footer out, the Jayhawks have been using Mitch Lightfoot and freshman Silvio De Sousa. I analyzed their last 7 games, which includes the 3 conference tournament games they played without Azubuike. The graphic below shows how their starting lineup performed when Azubuike was on the court with them compared to the starters with Lightfoot or De Sousa.  The results are incredible. Yes, their 2P% is higher offensively without Azubuike, but Penn may be able to mitigate this effect in their matchup due to the fact that they have the lowest percentage of shots inside the paint. The starters are significantly worse defensively without Azubuike – dropping them from .95 Def PPP to 1.16 Def PPP. Their 3P%, both offensively and defensively, also deteriorated without Azubuike on the floor. Penn could have its way from deep if Azubuike can’t play. The Jayhawks’ starting lineup allowed their opponents to shoot 40% when Azubuike was replaced by Lightfoot or De Sousa – 16% worse than with Azubuike. Good news for Penn fans, the Quakers have the ideal lineup to exploit the Jayhawks’ 3-point woes if Azubuike is out. The graphic below shows Penn’s ‘small ball lineup’, which was their most efficient lineup in 14 games of conference play this season.  This lineup shot over 52% from 3, which was almost 20% higher than all of Penn's other lineups. Their +.33 NetRtg is Penn’s most efficient lineup and by a wide margin. They only played this lineup around 6% of the time in conference play, but it’s worth noting that in their final regular season game they played this lineup almost 25% of the game – the most of any Penn lineup. Shots have to drop for the Quakers and Kansas needs to miss some tough deep jumpers, but it’s possible. If Azubuike is ruled out, watch for this lineup vs. the Jayhawks’ starters. It will probably decide the game. |
Categories
All
Archives
January 2020
|
 RSS Feed
Site powered by Weebly. Managed by iPage