
|
Sometimes good shots are missed. Sometimes bad shots are made. A team’s field goal percentage only tells half the story – the percentage of shots that are made. It’s time we start quantifying the shot itself and not just the result. I’ve developed a metric called ShotQ that will quantify team’s offensive and defensive shot quality. This stat evaluates the type of shot, defender distance, location of the shot, and more to measure the difficulty of the shot. It incorporates many of the same variables we use when we yell out “Why?!” or “NO!” after we see our player attempt a bad shot. ShotQ helps us better understand a team’s shooting performance. First, we need to do away with FG%. Effective field goal percentage (eFG%) is the best measure of shooting performance as it accounts for the extra point awarded on made 3s. There is about a .70 correlation between eFG% and ShotQ, indicating that shot quality is an excellent predictor of shot results. This is what we should expect. Good shots should lead to higher shooting percentages and visa versa. Knowing that these two metrics are so highly correlated, we can compare a team’s eFG% and ShotQ to gain insight about their players and project the trajectory of their eFG%. For example, as of today, William & Mary ranks #2 in offensive eFG%, but #43 in ShotQ. Offensive shot quality is a little trickier because we can interpret this difference in two ways. We could infer that William & Mary has really good shooters who can make the tougher shots in addition to the easier ones. Or we could claim that they’ve been lucky in making some difficult shots and we expect their eFG% to decline. 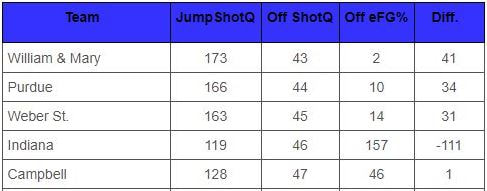 Defensively, it’s a little easier to interpret. Defenses guard many players throughout a season, which mitigates the impact of players making tough shots. When the sample size is large enough there is really only one way to interpret the difference between defensive eFG% and ShotQ. Villanova currently ranks #105 in defensive eFG%, while ranking much higher in ShotQ at #233. The Wildcats could see a hike in their eFG% rank over their next few games. 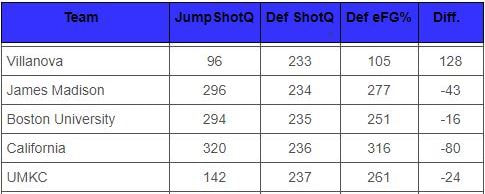 It’s important to note that just because we could expect a change in shooting percentage based off a ShotQ doesn’t mean that the increase or decrease will occur in the next game or games. Due to sample size limitations, the change could take weeks and, in some cases, it may not happen at all. Think of flipping a quarter: On 20 flips, it may come up heads 20 times or 100% of the time. Knowing that a fair coin should have a probability of 50-50, we should expect that as we continue to flip the quarter, our overall percentage will move closer to 50%. However, our next 10 flips could still be heads. Over time the percentage will correct itself, but it doesn’t mean it will happen right away. ShotQ finally allows us to measure the quality of shots our team attempts offensively and gives up defensively. Shot quality metrics have existed in the NBA for a few years now – I think it’s time to bring the metric to college basketball fans and coaching staffs. I will be posting daily updates to all 351 D1 teams offensive and defensive ShotQ on this page. You may notice there are two ShotQ columns. The JumpShotQ is the shot quality specifically for jump shots. The other is the overall ShotQ. It’s important to understand how a team shoots on jump shots alone as well as on all of their shots. When comparing to eFG% it is best to use overall ShotQ. Finally, we have a way to distinguish shooting luck from shooting skill.
7 Comments
Chuck Cooper
2/27/2018 05:46:08 am
Interesting concept, love to see all the data, but suggest a better format for viewing. Need a search function and sorting by name, conference, results.
Anon
2/27/2018 02:23:55 pm
Love the idea of the stat, but how is it measured? What do the numbers mean? I’m assuming a higher shotQ is better but I don’t know that. Looking at the numbers in the chart didn’t mean anything to me because I don’t know how they’ve come about.
Pete Cannon
2/28/2018 02:13:04 am
Awesome. Excellent analysis. Applies to baseball hitting as well.
Rusty Hodgkiss
4/29/2019 05:14:43 pm
Love the idea of a shot IQ, but don’t understand how to determine it. What are the factors and formula?
Payton A McCarthy
4/18/2021 02:05:10 pm
Are you able to produce this stat for individual NBA players in each season? This would be awesome for that Leave a Reply. |
Categories
All
Archives
January 2020
|
 RSS Feed
Site powered by Weebly. Managed by iPage