
|
The story was written a few years ago when shot data was examined in the basketball analytics movement – midrange shots are low efficiency shots. So why are some teams going against the trend and increasing their frequency of midrange shots? For this analysis, a midrange shot is everything in between the paint and 3-point line. Over the last 5 years, the FG% for midrange shots remained constant at roughly 35.5% to 36%. Therefore, this shot has an expected point value of 0.71 - 0.72 points per shot. How does this value compare to alternative shot locations? During this same period, shots within a few feet of the basket were worth between 1.16 and 1.21 points per shot. Farther paint shots exhibit an expected points per shot value that is closer to the midrange shots than shots within a few feet of the rim. Three-point shooting percentages over the last 5 years have been between 34% and 35%, but the extra point for a 3 makes these shots highly efficient at 1.04 points per shot. It’s also worth noting that corner threes provide additional value. Corner 3s are made at a 2.7% higher clip than above the break 3s, giving them a value of roughly 1.12 points per shot. Some have suggested that midrange volume helps a team open up the perimeter to get better looks from three. DribbleHandoff conducted a statistical analysis using the last few years of NBA and NCAA data to test this theory. The results do not support the notion that shooting more midrange shots will increase a team’s three-point percentage. Even if there was an increase, it would likely not be large enough to offset the value lost from shooting more shots from midrange instead of threes or shots at the rim. Coaches know the math. The midrange is dying. The table below illustrates the decline of the midrange for both the NBA and college basketball. 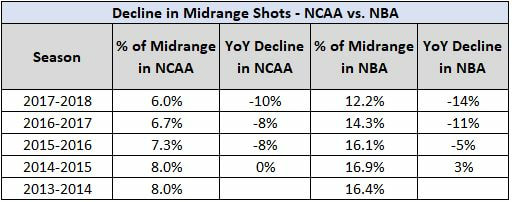 In fact, college basketball actually takes half of the amount of midrange shots as the NBA. As they should. The difference between a midrange shot and a three or shot at the rim is larger at the college basketball level than the NBA. Using data from the last 5 seasons, the midrange points per shot in the NBA is roughly .79 points per shot compared to college basketball’s .715 point per shot. Threes in the NBA are worth about 1.06 points per shot, while they are worth 1.04 in college basketball. Taking a midrange shot sacrifices at least .325 points per shot compared to alternative options, while it’s just .27 points per shot for the NBA. Context of specific possessions and team personnel can slightly dictate how a team will strategize their midrange shot selection, but, overall, coaches should study the team’s shooting the lowest percentage of midrange shots. The Houston Rockets, one of the NBA’s most analytically driven teams, have been shooting the lowest percentage of midrange shots for years. It’s helped propel them to the best offensive rating in the NBA over the last year and a half. Teams looking to completely transform their shot selection should study the changes made by Mike Budenholzer in his first season as the Bucks’ head coach. Last season, they were 3rd highest in percentage of shots from midrange. They are now 25th highest. Their offensive rating ranking jumped from 9th last year to 4th this season. College coaches remain at the forefront of the shot selection revolution. The table below shows the 5 teams with the lowest percentage of midrange shots this season. 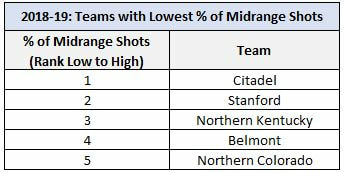 On the other end, Florida A&M and Kennesaw State are taking the highest percentage of shots from midrange by a large margin. What if Kennesaw State converted it’s 18% midrange shots to the D1 average of 6% and used the remaining 12% on 3s? Transforming their shot selection would result in more points per game even if they shot these 3s at the lowest 3P% of any team last season, 27.5%. If they shot them at the D1 average 3P% it would result in over a 2.3 point per game increase. An increase of 1-2 points per game is significant. Last season, 10% of games were decided by 2 points or less. This is also applicable at the player level. Charlie Brown are Markus Howard are two of the best shooters in college basketball. Brown is shooting a higher percentage from the field than Markus Howard. Yet, Howard has a higher effective field goal percentage (eFG%). The difference is in their shot selection. Brown shoots 14% of his shots from midrange compared to Howard’s 4%. There’s very little difference between these shooters, but Brown’s inefficient shot allocation will make it look like Howard is a better shooter. 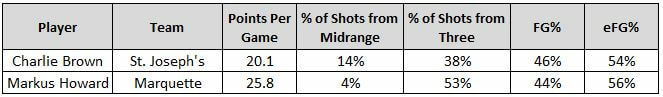 *Data through 1/13/18
The shot selection revolution is here, and the data suggests that the decline in midrange attempts will only continue.
4 Comments
A few years ago, the NBA had an analytics movement. Similar to the one that occurred in baseball years prior, some of the long-held strategies were challenged. Teams began to prioritize efficiency over counting stats. This resulted in personnel changes; front offices began to favor stretch players and smaller lineups. Coaching staffs made strategic adjustments to improve ball movement, spacing, and pace at the expense of hero-ball.
Front offices tracked everything – shots, touches, lineups, player’s on/off court impact, expected shot value, etc. One of the earliest findings was that the corner 3 has the highest expected shot value. Data from the 2016-17 NBA season shows that corner 3s had a 3P% of 39.4%, while center and wing 3s were shot at 34.4% and 34.9% clips, respectively. Expected shot value is calculated using the location’s shooting % and point value. Therefore, the expected point value of a corner 3 in the NBA is 1.182 (.394 x 3). This marginal lift on corner 3s became a competitive advantage for the teams that studied the play types that generate these shots, why there was a lift, and how they could shoot more of them. So now everyone’s wondering: Does the lift on corner 3s exist in college basketball? Yes. An analysis of 2016-17 NCAA D1 data shows that there is a 2.5% increase in 3P% between corner 3s and non-corner 3s, or above the break 3s. 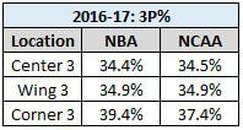
Some have argued that the corner 3’s value was due to the shorter distance to the rim as the NBA 3-point line is 22’ feet in the corner and extends up to 23’9”. However, the college 3-point line is equal at all spots along the line at 20’9” and there is still a substantial lift on corner 3s. Furthermore, using NBA data, a comparison can be made between corner 3s taken from 22’ and 2-point shots also taken from 22’. The 22’ corner 3s are made at a 39.4% clip compared to a 37.7% clip on 22’ shots from inside the arc. It’s not distance. So, then, what is the cause of the lift on corner 3s? An analysis of shot quality, using data from NBAsavant.com, provides the best explanation. The graphic below shows average dribbles, average touch time, and average defender distance for corner 3s and above the break 3s. 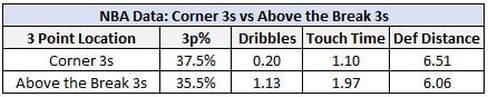
The corner 3 is less contested, on average, and a higher percentage of these shots are catch and shoot, which are made at higher rates than shots off the dribble. The database doesn’t provide true catch and shoot data, but 91% of the corner 3s were shot without a dribble compared to 72% for above the break 3s. This suggests it’s all about what happens before the shot – the corner 3 is the byproduct of the possession. The teams that take the most corner 3s get the defense to collapse and lose their assignments. The best ways to get a corner look is to penetrate the defense or getting a touch in the paint. Defenses that decide to double team players in the post risk getting beat on a pass to the corner. Is it possible to identify the teams with the highest lift on corner 3s through a specific stat? There isn’t a metric in college basketball that measures these types of possessions. However, the teams with the highest lifts on corner 3s had a player in common – a 6’8”+ big man who shot at least 60% on 2s, an assist rate above 8%, and a usage rate above 20%. These are taller big men who dominate in the paint and frequently draw double teams or extra attention. Once the double comes, they are adequate passers to find the open man in the corner. Teams with these players shot 5.1% better on corner 3s than above the break 3s - 2.6% better than the D1 average lift. Which teams had the highest lift last season? Creighton – 51% on Corner 3s (14.5% lift Corner 3 vs Above the Break) Middle Tennessee – 44.1% on Corner 3s (9.4% lift) Texas A&M – 40% on Corner 3s (9.1% lift) Shooting at a high percentage from the corner is only part of the equation. Teams need to try to create as many opportunities for corner 3s as possible. The NBA has used the data to their advantage – the NBA average for percentage of 3s that are corner 3s continues to increase. The chart below shows the percentage of 3s from the center, wing, and corner for the NBA and NCAA. 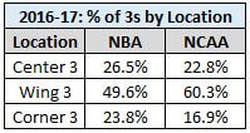
NBA teams take 7% more 3s from the corner than D1 teams – they studied this shot and know how to take more of them. Corner 3s remain an untapped goldmine in NCAA basketball right now. It’s time college coaches study and follow their NBA counterparts. Some have already caught on. In a press conference last year, Marshall Head Coach Dan D’Antoni, brother of 3-point revolutionist Mike D’Antoni, said, “The best shot in basketball is that corner three.” Who listened? “We don't measure our performance on if shots go in. We measure it on -- I don't mean to be too analytical -- expected shot value.” – Brad Stevens, Boston Celtics Head Coach |
Categories
All
Archives
January 2020
|
 RSS Feed
Site powered by Weebly. Managed by iPage